Dej plus Home Dashbaord
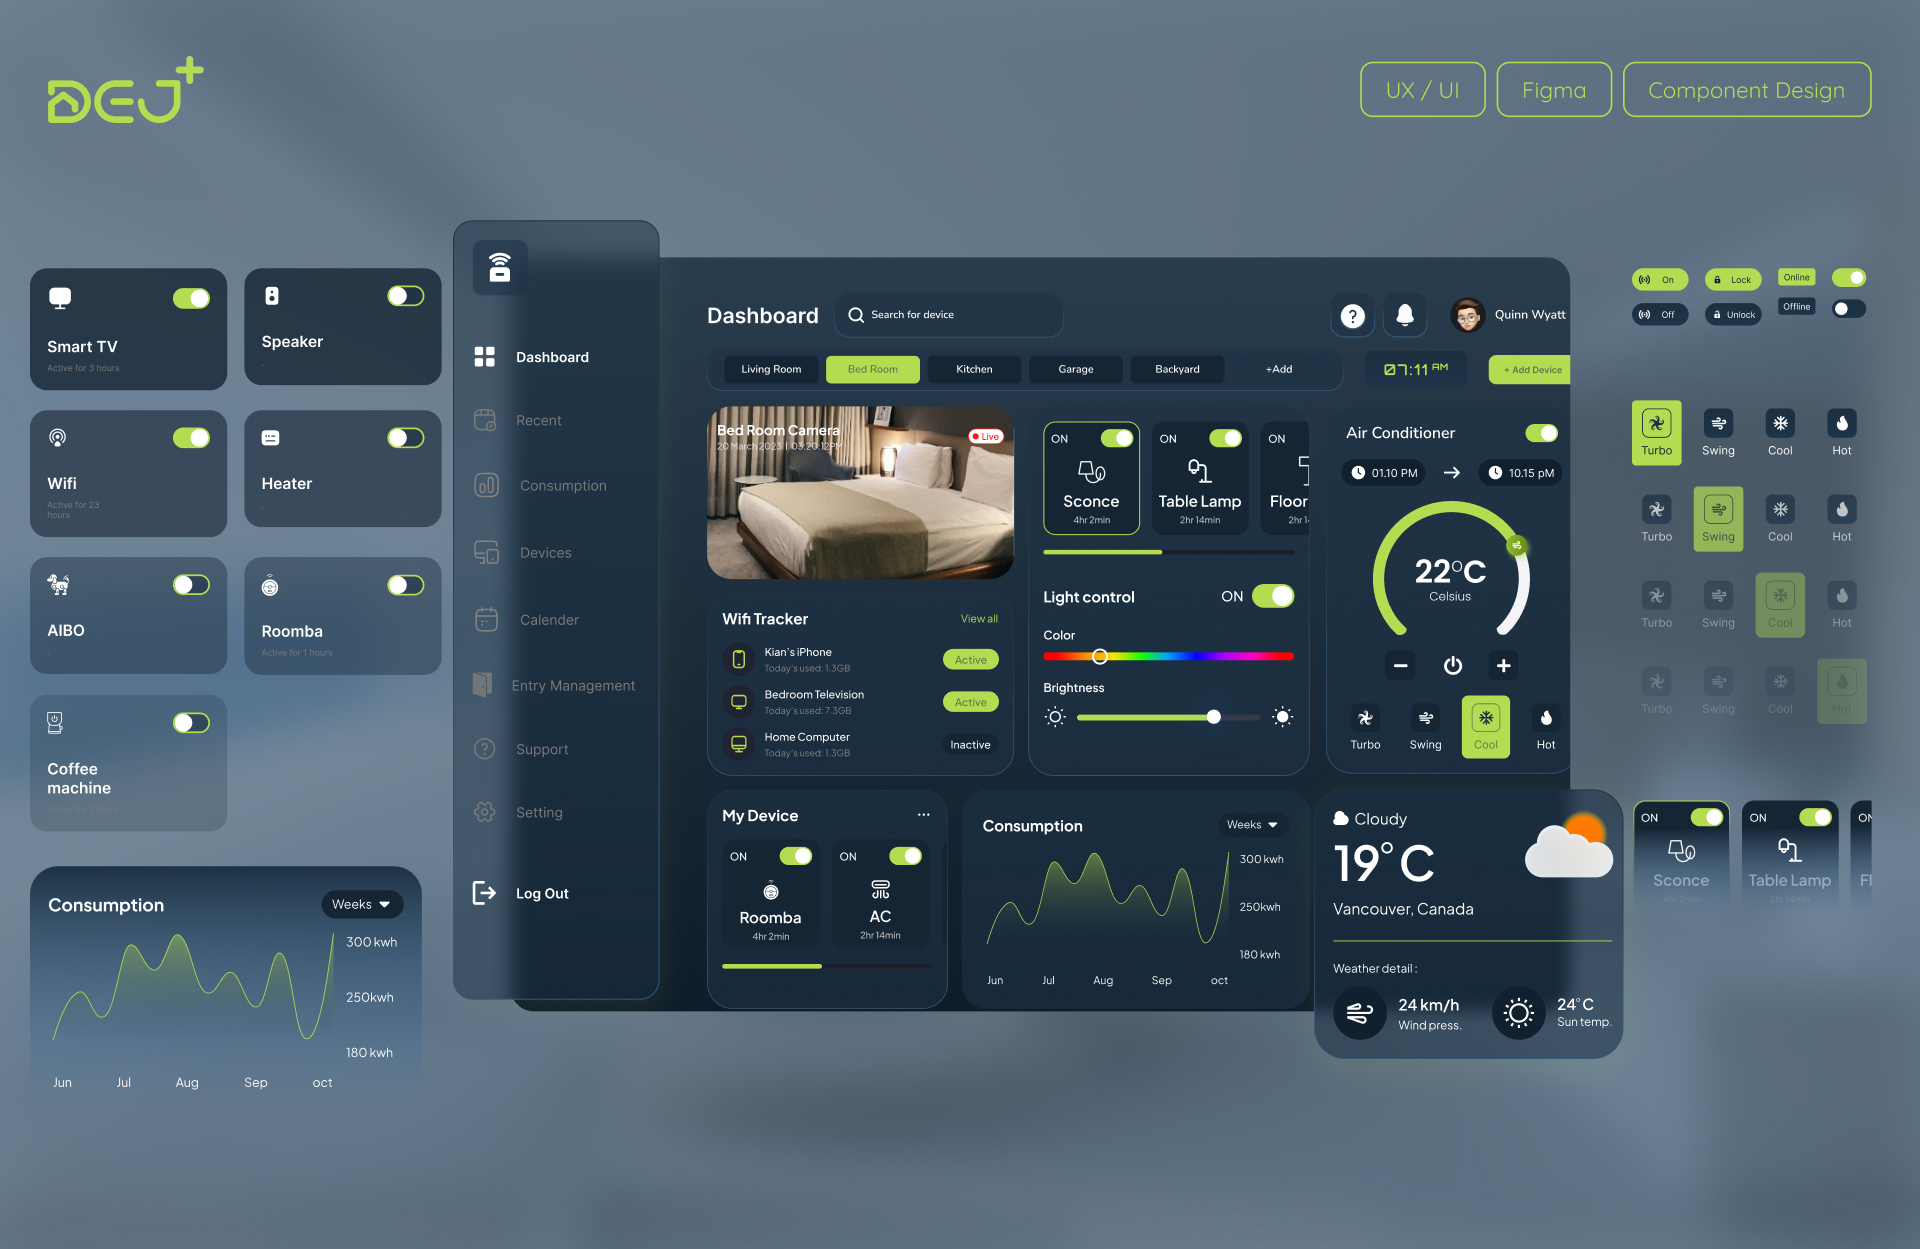
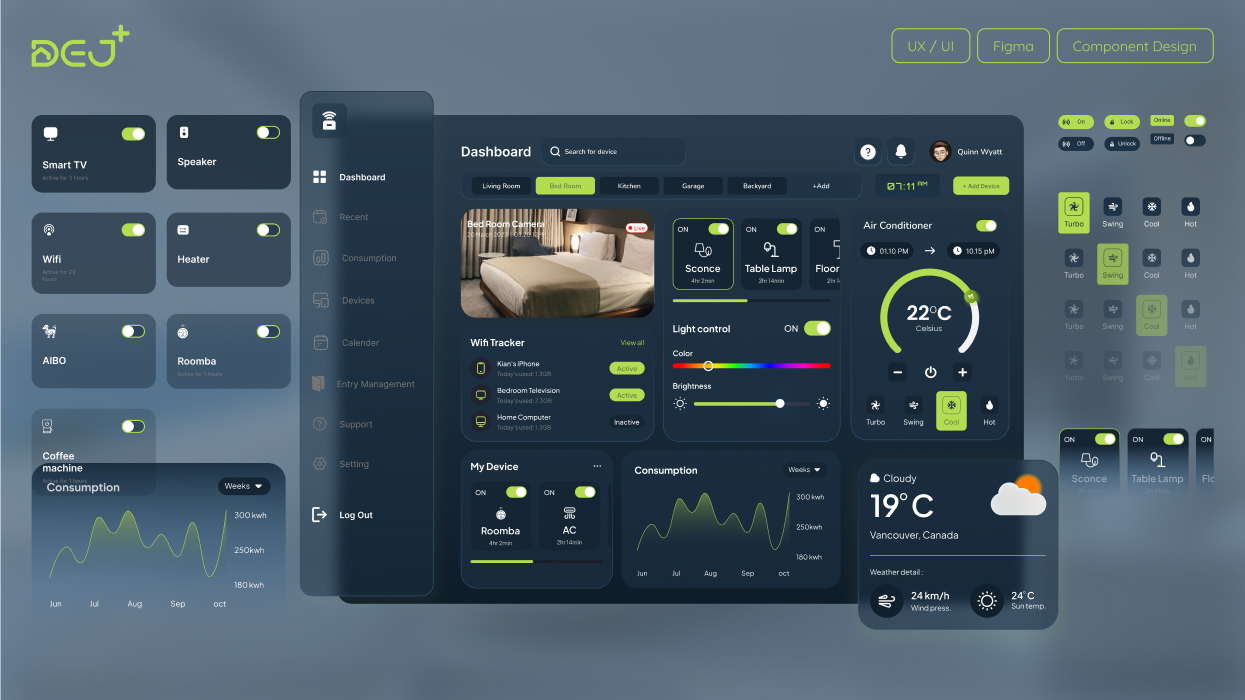
Welcome to the case study for the Dej Plus Home Dashboard UX/UI Design project. This project focuses on creating an intuitive and user-friendly interface to enhance user experience, streamline navigation, and provide seamless access to home management features.
Members
AmirKian Ashrafi
Year
2023
Service
UX/UI Design
Tools


Introduction
This UX/UI project focuses on developing a smart home dashboard, Dej Plus, as an extension of the real estate application, Dej by Kimia Ashrafi.
Objective
- Enhance user convenience and control
- Improve home security and monitoring
- Promote energy efficiency and sustainability
Vision
To create the ultimate smart home experience, seamlessly integrating technology into daily life to provide comfort, security, and efficiency.
Mission
Ensure seamless integration and compatibility with various smart home devices and promote sustainability by optimizing energy use and providing eco-friendly options.
phases
1.Reseach
- User Research
- Inspiration
2.Brainstorming
- Idea Generation
- Concept Refinement
3.Design
- Low-Fidelity Wireframe
- Components &High-Fidelity Wireframe
Reseach an Inspiration
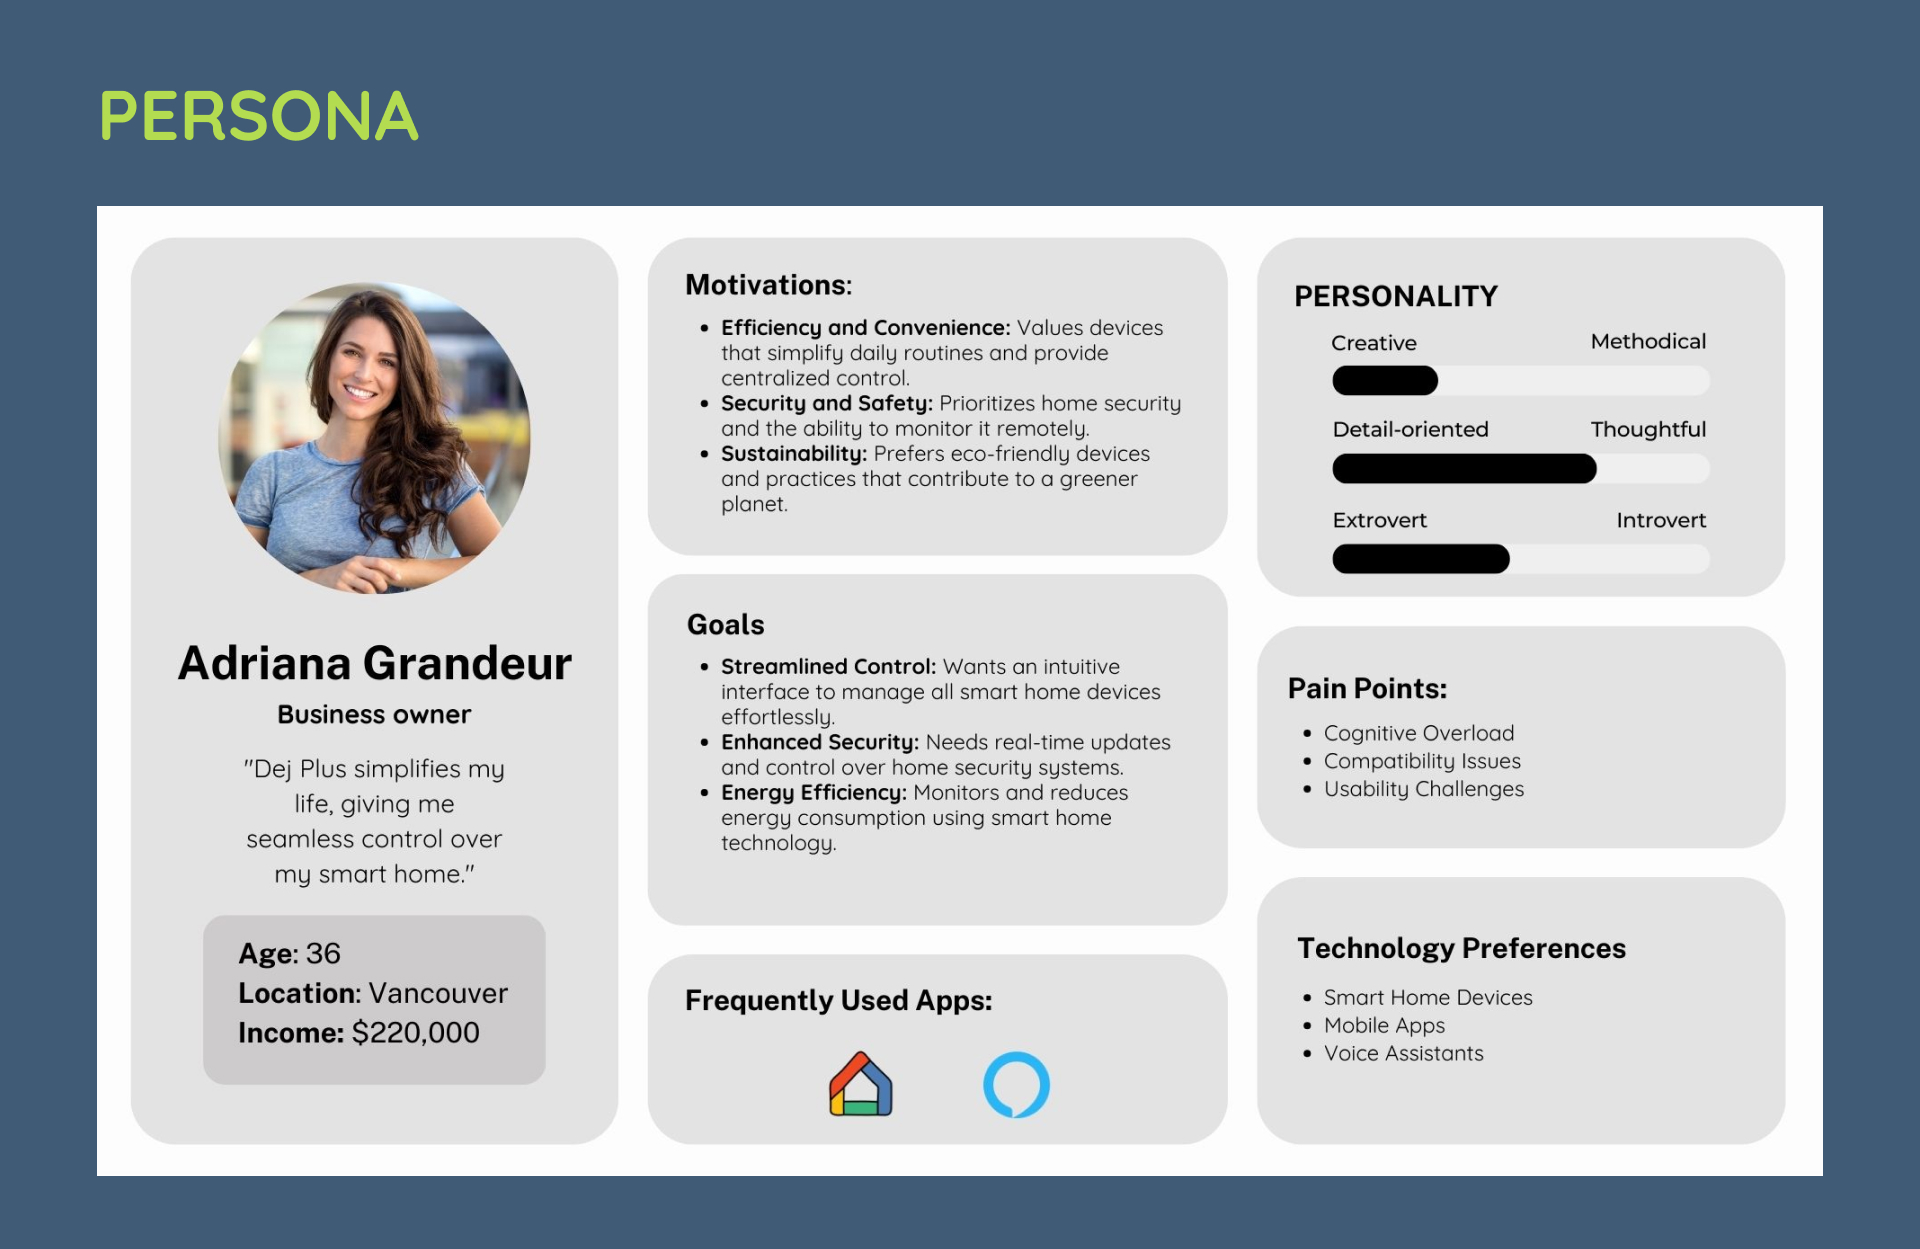
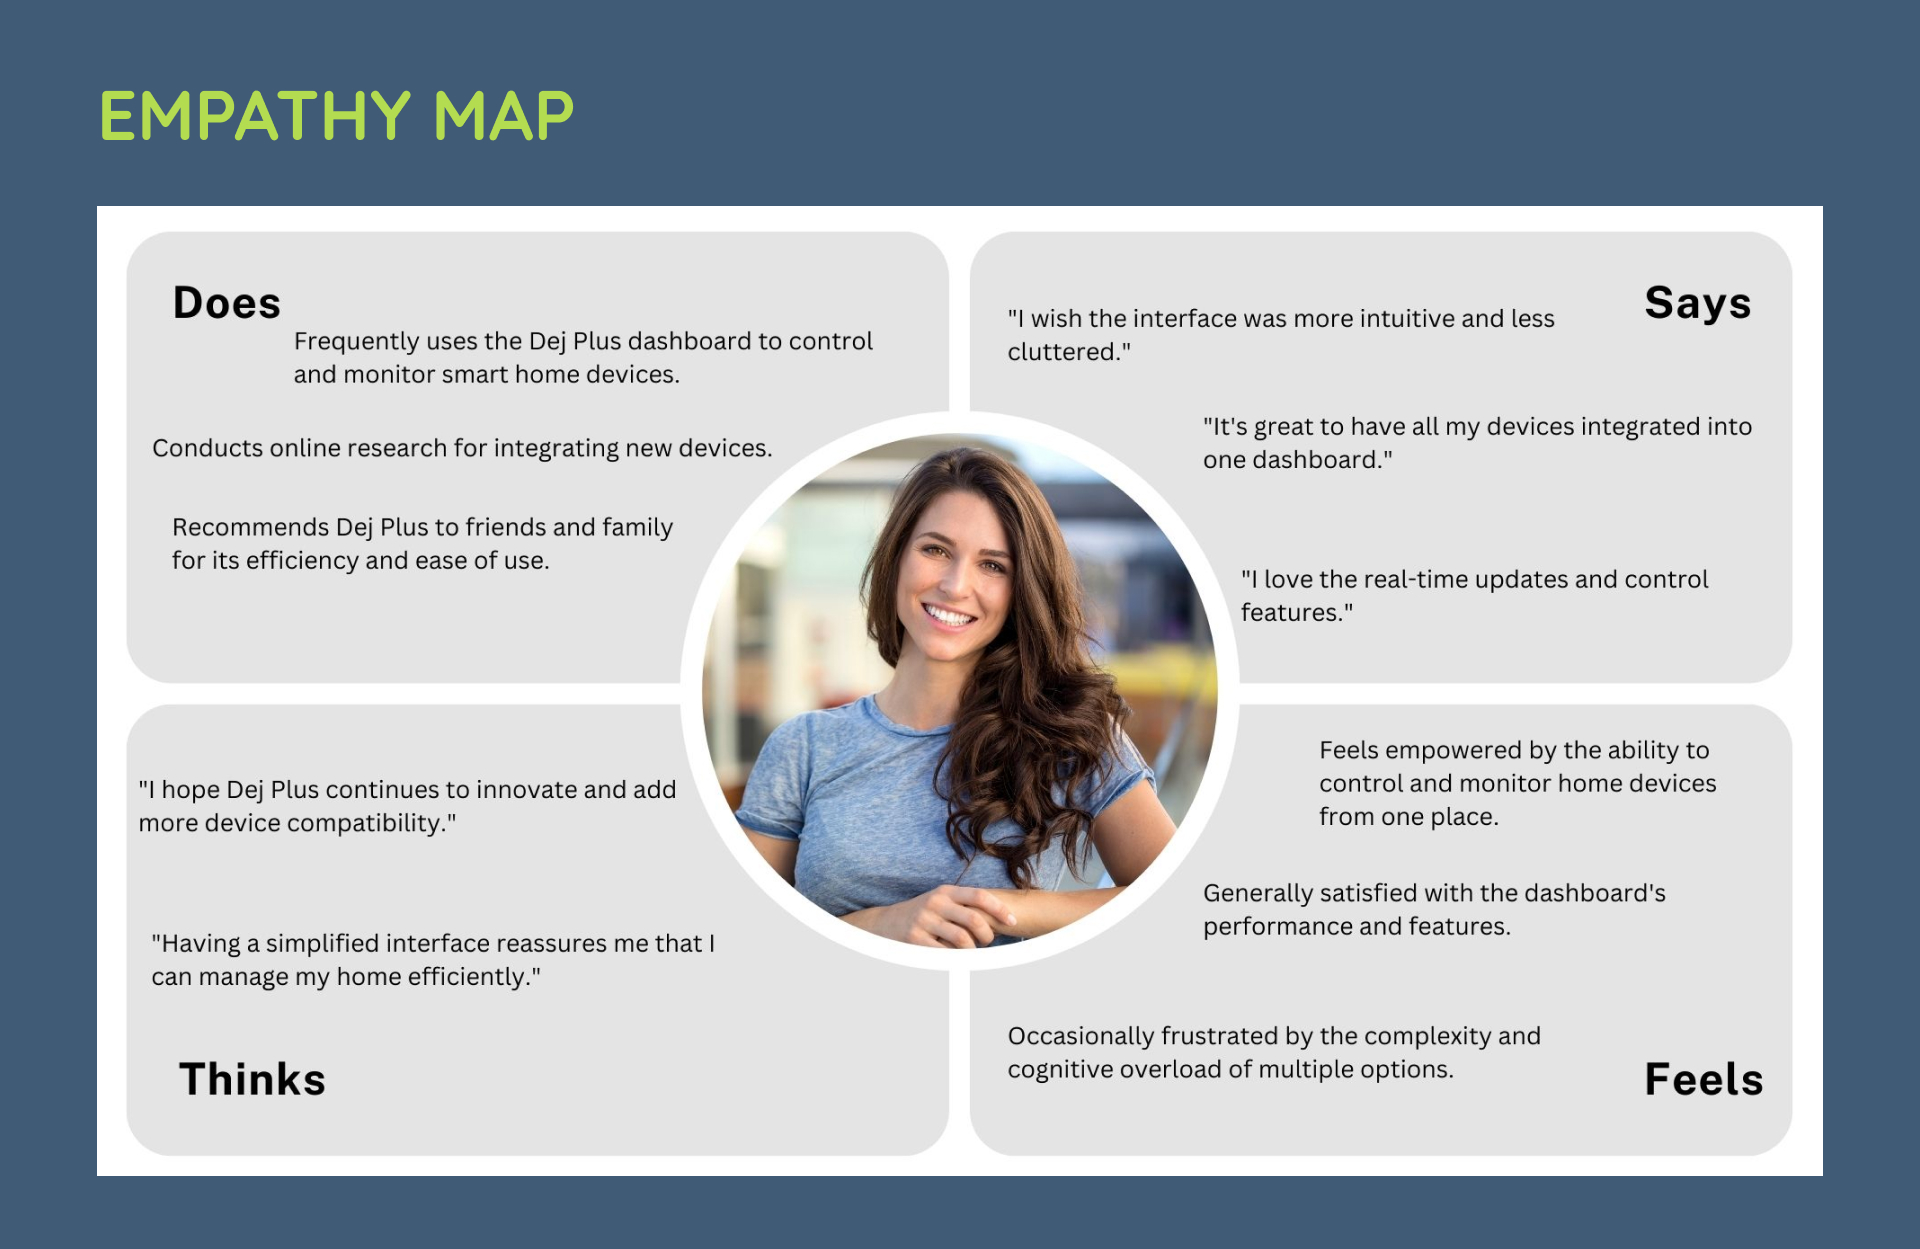
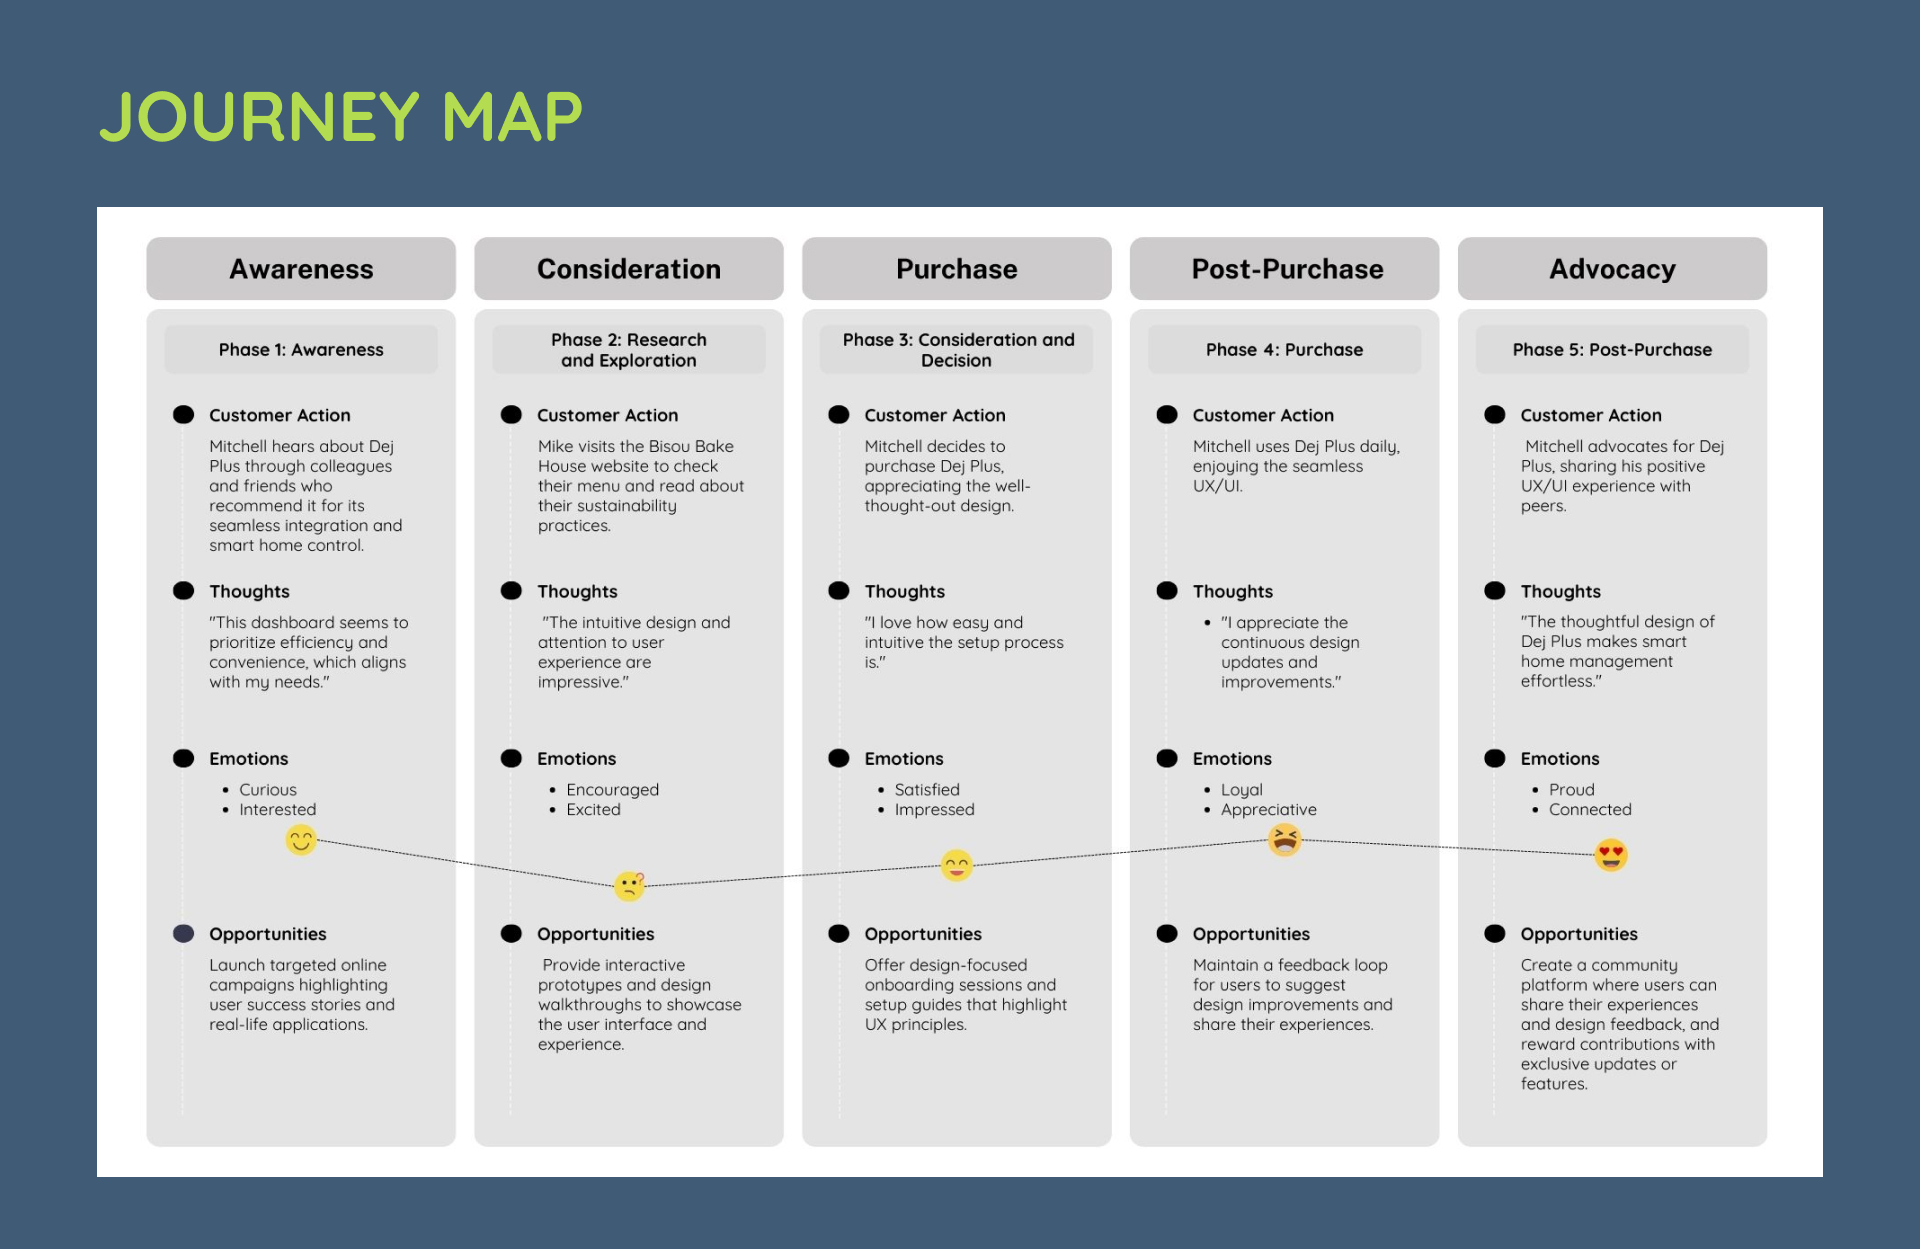
For the Dej Plus Smart Home Dashboard project, I conducted thorough research to address user needs and challenges effectively. This included understanding user behaviors, pain points, and preferences through empathy maps, journey maps, user personas. The goal was to create a user-centered dashboard that ensures seamless integration, intuitive controls, and enhanced usability, ultimately improving the overall smart home experience.
User Reseach
Brainstorming
Idea Generation
For the Dej Plus Smart Home Dashboard project, I started with a brainstorming session to generate diverse ideas for the dashboard’s layout, features, and user interactions. This helped me explore creative solutions and identify the best approaches to meet user needs.
Concept Refinement
After generating ideas, I refined the concepts, focusing on the most promising ones that aligned with the project’s objectives. This process ensured that the final design would be both innovative and user-friendly, offering a seamless experience for users.
Design
Low-Fidelity Wireframe
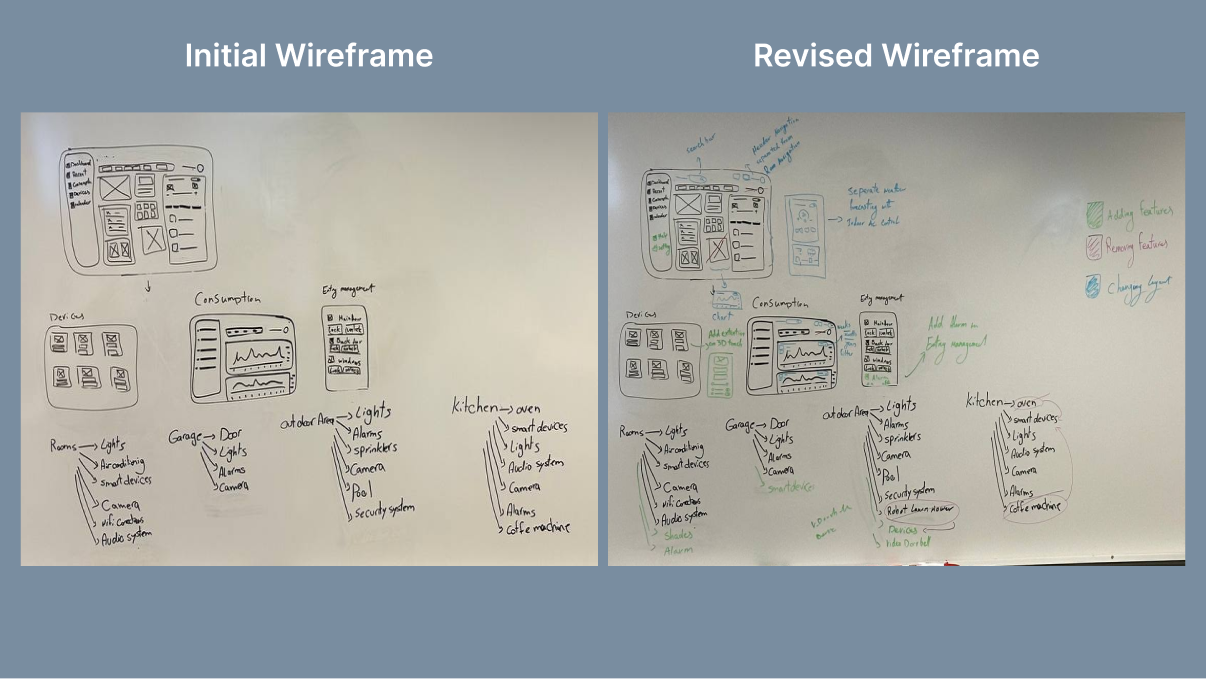
The initial low-fidelity wireframes for the Dej Plus Smart Home Dashboard established the basic structure and layout of the interface. They served as a blueprint for organizing content and planning user interactions.
Componants
Air Conditioner
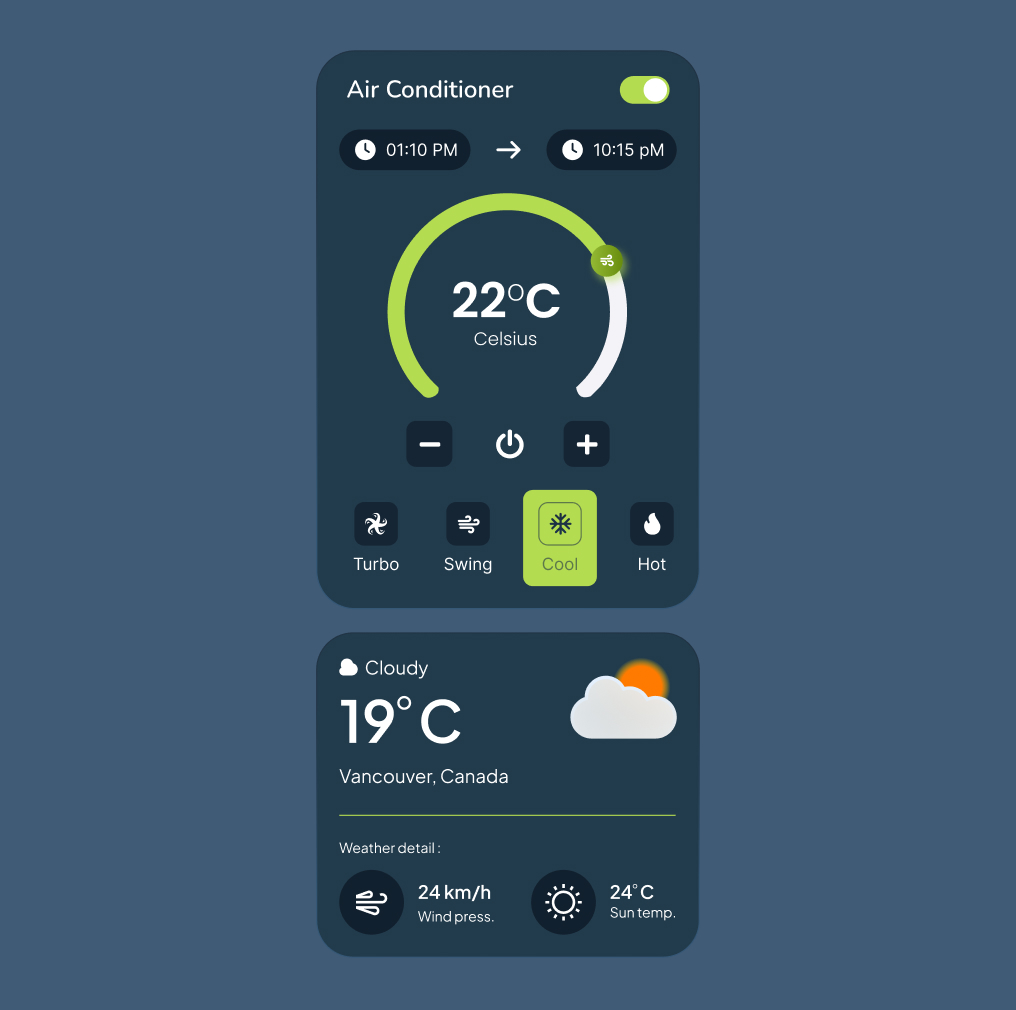
The air conditioner and weather components of the Dej Plus Smart Home Dashboard provide users with comprehensive control over their home environment, ensuring comfort and convenience.
Air Conditioner Component
Scheduling
Temperature Control
Visual Feedback
Weather Component
Current Weather
Location-Specific
Detailed Information
Design Highlights
User-Centered Design
Real-Time Updates
Light Control Component
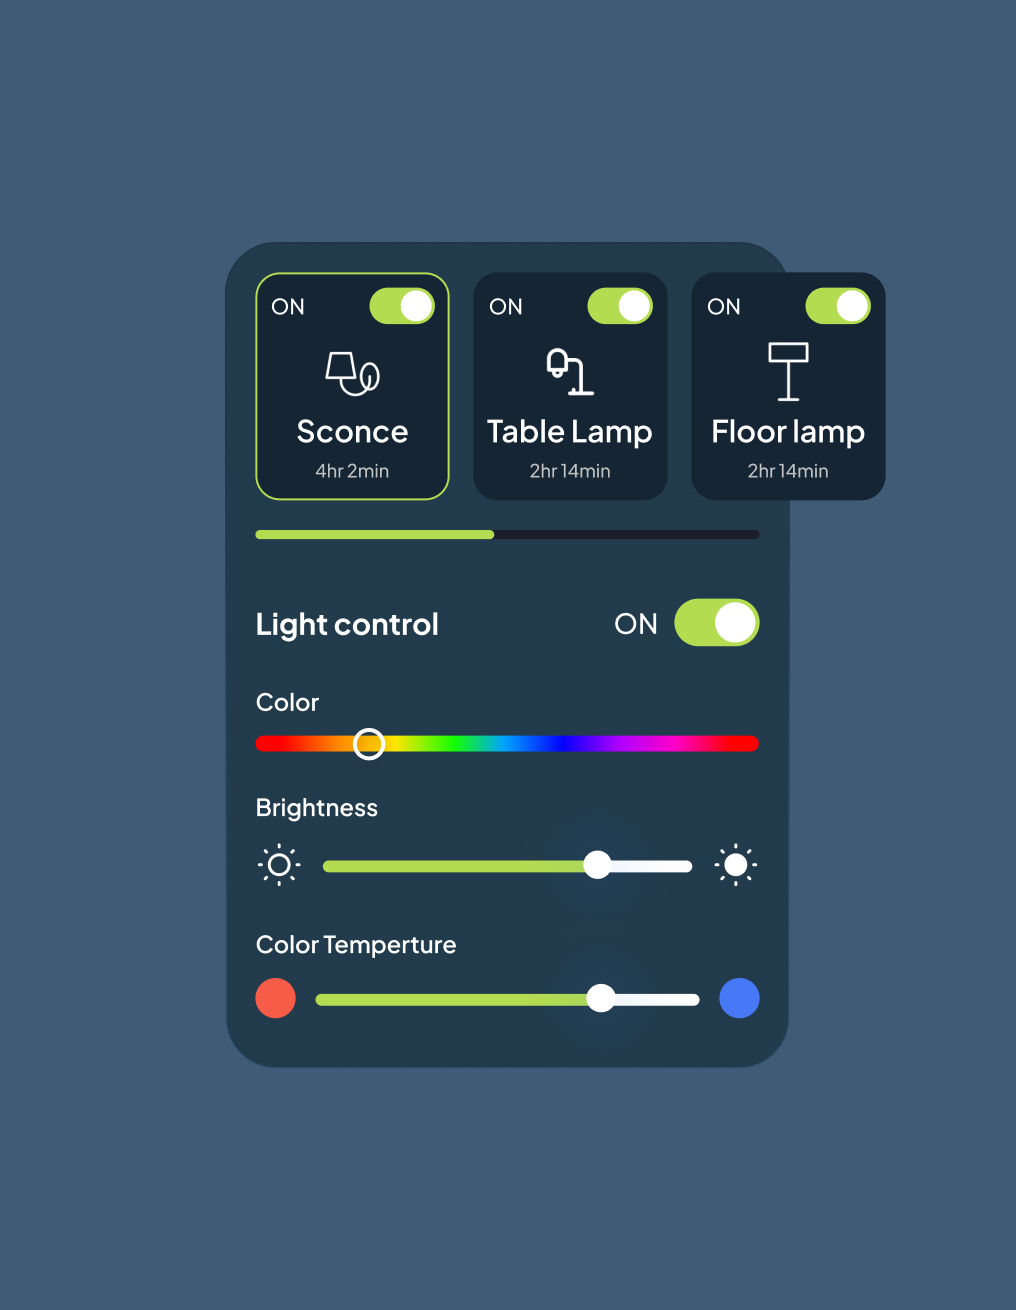
The light control component of the Dej Plus Smart Home Dashboard provides users with detailed control over their lighting, ensuring optimal ambiance and energy efficiency.
Light Control Component
Power Control
Device Management
Color Control
Brightness Control
Color Temperature
Design Highlights
User-Centered Design
Comprehensive Control
Real-Time Feedback
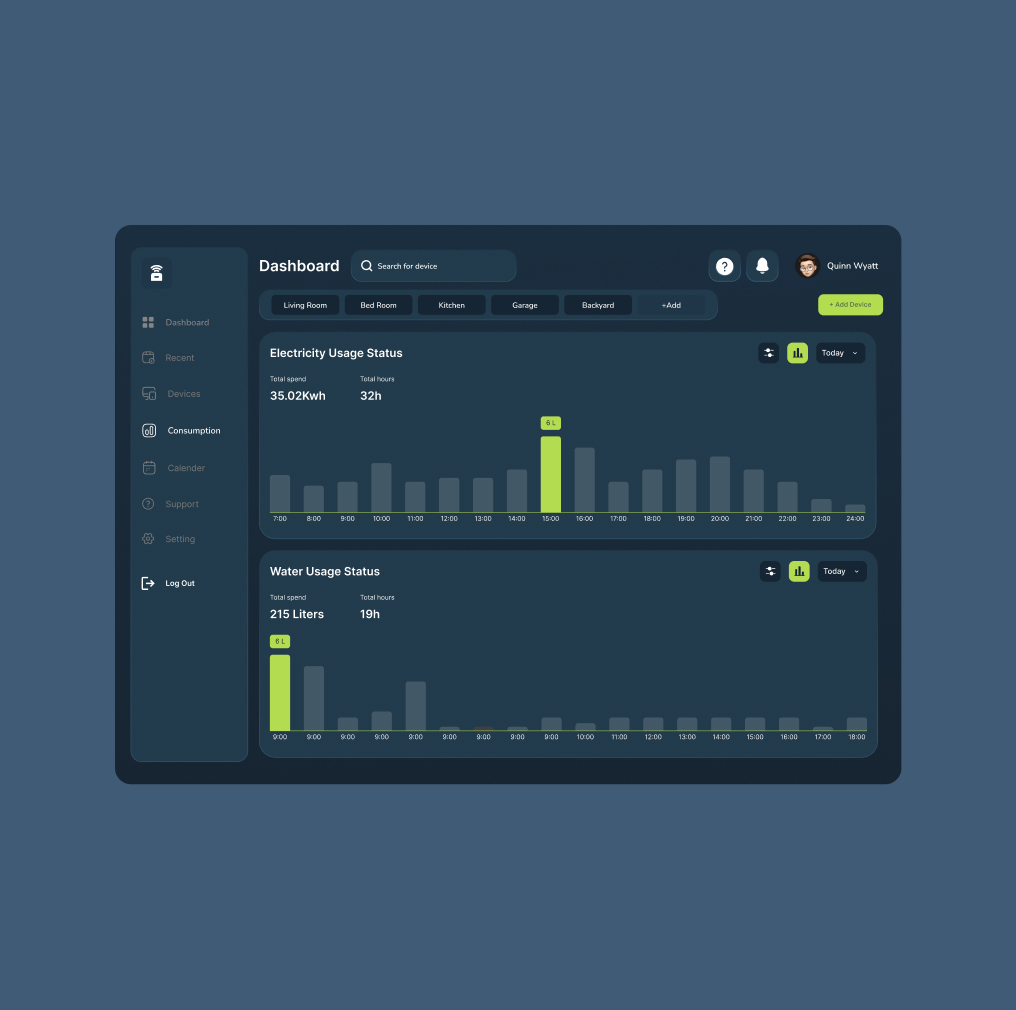
Consumption
The consumption component of the Dej Plus Smart Home Dashboard allows users to monitor their electricity and water usage, promoting energy efficiency and cost savings.
Electricity Usage Status
Total Usage
Usage Hours
Usage Graph
Water Usage Status
Total Usage
Usage Hours
Usage Graph
Design Highlights
Accessible Design
Timely Feedback
Visual Feedback
Conclusion and Reflection
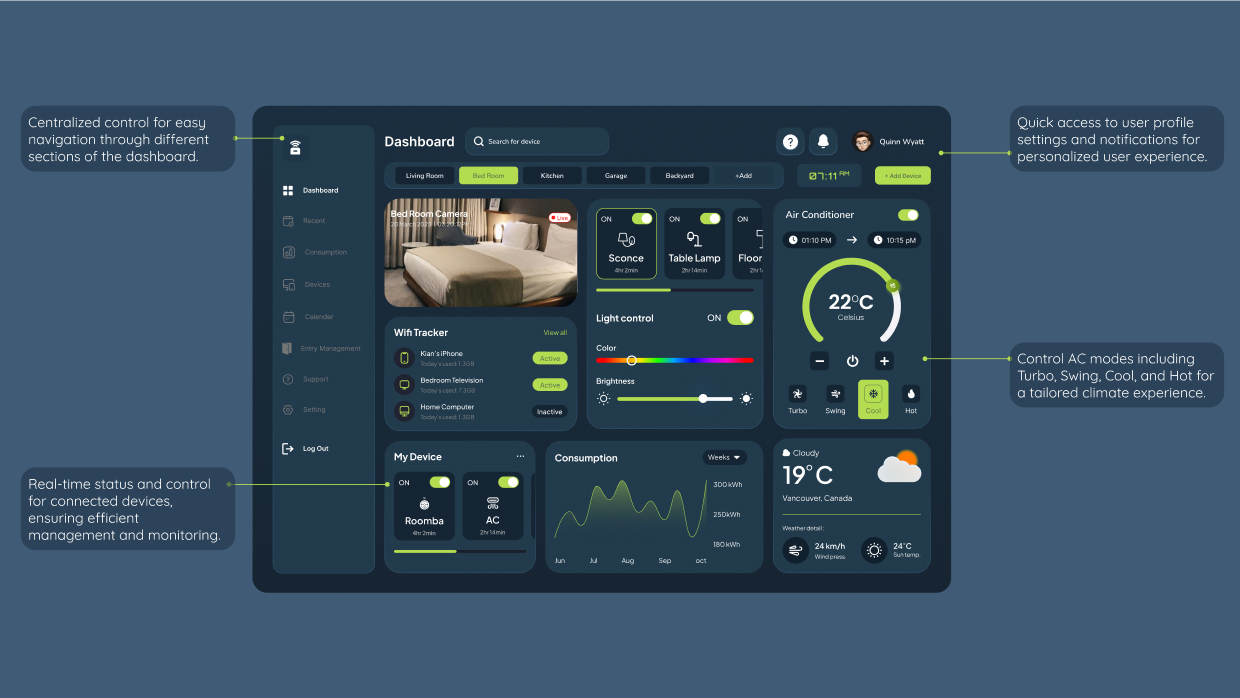
The Dej Plus Smart Home Dashboard project successfully aimed to create a user-centered interface that enhances home management through intuitive design and seamless integration.
Conclusion
The Dej Plus Smart Home Dashboard successfully delivered a user-centered interface for managing home devices with intuitive design and seamless integration. Key features like air conditioner and lighting control, along with consumption monitoring, made the dashboard both functional and user-friendly. The project underscored the importance of usability testing and iterative design.
Reflection
This project emphasized the value of user research in guiding design decisions and the effectiveness of an iterative approach. Usability testing provided critical feedback, leading to continuous improvements. Future enhancements could focus on expanding device compatibility and refining user interactions, reinforcing the importance of user-centered design.
Works & Projects
Discover the dedication and meticulous care behind each project, crafted with passion and precision.
- Show All
- Project Management
- marketing an branding
- UX/UI design
- Web Development

